

Ever feel like your project plan is all over the place? The project timeline Google Sheets template sorts out the clutter and makes planning simple. This free, ready-to-use Gantt chart (a visual timeline for project tasks) lets you track tasks, deadlines, and important milestones all in one view. With quick setup and live updates, you can plan, share details, and stay on top of every step without wasting time. It improves team work and cuts down on extra meetings so you can keep your projects running smoothly.
Quick-Start: Download the Project Timeline Google Sheets Template

Find a ready-to-use project timeline template in the Google Sheets gallery. This free template shows a clear Gantt-style chart that maps your tasks, deadlines, and key milestones. Just copy it to your drive and start planning. It’s built for quick setup and real-time updates so you can work as a team with ease. For another view, check out the template at https://neull.com?p=122.
- Click the copy button to add the template to your Google Drive.
- Rename the file to match your project title.
- Update basic details like due dates, assigned team members, and task durations.
- Enter your first tasks to build your schedule.
- Share the file with your collaborators so everyone can update it together.
Google Sheets shows live changes. As your team updates task status, the timeline stays current, keeping every deadline and milestone in view. This hands-on approach cuts down on meeting time and makes tracking your project a breeze.
Structuring Your Project Timeline Spreadsheet in Google Sheets
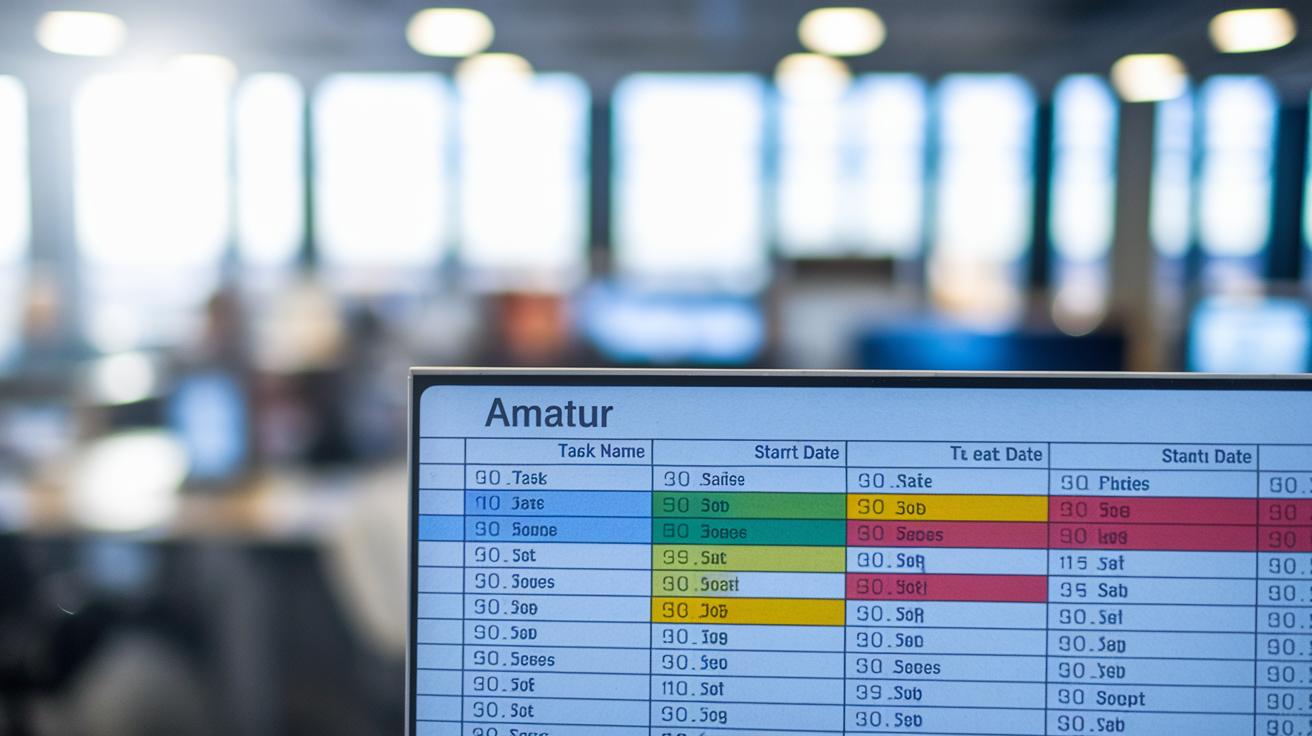
Your spreadsheet maps out tasks and milestones using clear columns. The template includes columns for Task Name, Start Date, End Date, Duration, Status, and Assigned To. Task Name holds brief descriptions, while Start and End Dates set your timeline. Duration calculates automatically with the DAYS function (it subtracts dates) so you see how long each task takes. The Status dropdown gives preset progress updates, and Assigned To shows which team member is in charge. A sample project is set for five phases running from Jan 4 (1/4) to Feb 28 (2/28), with key milestones marked by a special color.
Each column has a role. Start and End Date columns have date validation to keep errors at bay. The Duration column updates with any change in dates. The Status dropdown uses data validation to ensure entries stay consistent and clear. You can link the Assigned To column to your team roster for quick lookup. Feel free to rename headers or add columns such as Priority or Estimated Cost to match your project needs. Custom tweaks like these help your spreadsheet work right for your team, no matter the project size or style.
Customizing Your Google Sheets Project Timeline Layout and Visual Formatting

Setting Up Conditional Formatting
Start by selecting the date grid that holds your timeline bars and open the conditional formatting panel. Then, create rules for each task status. For example, set one rule so that any cell with "In Progress" fills with blue, and another so that "Complete" turns green. Pick color fills that clearly show different statuses, so you can see progress at a glance. Use the dropdown menu to select which parts of the timeline update based on status. You can also use a date formula like TODAY() to auto-highlight tasks when today falls between their start and end dates. This setup keeps your schedule easy to read and responsive as work continues.
Applying Color Scales and Bar Chart Bars
Once conditional formatting is ready, adjust the cell widths to mimic horizontal bars for each task. Next, apply gradient fills by selecting a range of colors that grow more intense as deadlines near. For example, you might start with light yellow for tasks that have plenty of time, shifting to deep red for tasks running out of time. Also, adjust cell alignment and row height to ensure your bars stand out clearly and remain proportional. This color gradient serves as a visual alert, helping everyone see key dates and progress updates. Save your custom theme so you can carry these settings into future projects.
Implementing Dynamic Formulas in Your Google Sheets Project Timeline

Using formulas in your timeline means fewer manual updates and fewer mistakes. With live formulas, your schedule updates instantly when dates change so your team always sees the current progress. This saves time and keeps your records accurate when tracking project milestones.
Start by using NETWORKDAYS() to count working days between two dates. For example, type =NETWORKDAYS(B2, C2) in the Duration cell. Here, B2 holds the Start Date and C2 holds the End Date. This formula ignores weekends, giving you only the workday count.
To handle blank or wrong entries, wrap the formula in IFERROR(). For instance, =IFERROR(NETWORKDAYS(B2, C2), "") stops error messages from popping up.
Next, apply the formula to an entire column with ARRAYFORMULA(). For example,
| Example Formula |
|---|
| =ARRAYFORMULA(IF(B2:B=””, “”, NETWORKDAYS(B2:B, C2:C))) |
This lets any new task row automatically show its duration without copying the formula each time.
To track progress, calculate the percent complete by using =(TODAY()-B2)/(C2-B2). This shows how much of a task is finished based on today’s date compared to its start and end dates.
Finally, define a named range like "Tasks" to cover all your task rows. Any chart or formula that points to "Tasks" will update automatically when you add new tasks. This makes your timeline a dynamic organizer for your project planning.
Building a Project Timeline Dashboard in Google Sheets

A dashboard tab makes tracking progress simple. It gives you a quick look at upcoming tasks and overall work status.
Adding a Gantt Overview Chart
Pick the cells with your task dates and durations. Then, insert a stacked bar chart. This chart acts like a timeline, where each part shows how long a task lasts and where tasks overlap.
Creating a Status Distribution Pie Chart
Next, set up a pie chart to show counts from your status choices. As you update tasks from "Not Started" to "In Progress" or "Complete," the chart will update automatically. This visual helps you see your team's progress at a glance.
Designing a KPI Table with Key Metrics
Build a table with formulas that calculate important numbers like overall percent complete, days remaining, and milestone counts. If you need to, use IMPORTRANGE() to bring data from other sheets. This table gives you an easy summary to guide your decisions.
Best Practices for Your Project Timeline Google Sheets Template

Start by setting up a regular routine to update your project timeline. Check your sheet daily or weekly to keep everyone up to date and avoid any gaps in information. At the end of each workday or week, take a few minutes to review important dates and update each task’s progress. It also helps to save a backup copy often, naming it with the current date, like "Timeline Backup 04-25-2023," makes it easy to track changes and fix mistakes.
Keep your sheet organized by protecting key parts. Lock your header rows so they aren’t accidentally changed and use drop-down menus for status entries such as "Not Started," "In Progress," and "Complete" to keep the timeline clear and uniform. For a tidy view of your active tasks, move finished phases to a hidden tab while still keeping past data for reference.
If your project grows in complexity, you might need more than Google Sheets can offer. When you’re linking multiple sheets, managing task dependencies, or tracking full-time equivalent (FTE, a measure of work done by one person) metrics, upgrading to a specialized project management tool can make your work smoother and more efficient.
Final Words
In the action of taking control of your home projects, you learned how to launch your plan with a ready-to-use project timeline google sheets template. We covered copying the template, setting up columns, applying custom formatting and dynamic formulas, and designing a dashboard to keep track of progress.
Breaking tasks into clear, manageable steps helps you stay on budget and on schedule. Enjoy fine-tuning your timeline and watching your project grow, knowing you’ve built a solid foundation for success.
FAQ
Frequently Asked Questions
- How do I create a project timeline in Google Sheets?
- Creating a project timeline in Google Sheets involves copying the free template to your Drive, renaming it, adjusting properties, entering tasks, and sharing with collaborators for real-time project updates.
- Does Google offer a free timeline or project management template in Sheets?
- The free project timeline Google Sheets template is available in the Google Sheets gallery and offers a ready-made Gantt chart and task tracker to quickly manage project deadlines and milestones.
- How do I download and set up the free project timeline Google Sheets template?
- To download and set up the free template, open it in Google Sheets, make a copy in your Drive, rename it, adjust the basic properties, and enter your first tasks for an immediate project start.
- Can I customize the layout and formulas in the Google Sheets timeline template?
- Yes, you can customize the layout by adjusting columns, applying conditional formatting, and using dynamic formulas like NETWORKDAYS() and ARRAYFORMULA() to automatically update task progress and project details.
- How does the template support project collaboration and dynamic updates?
- The template supports collaboration by allowing real-time editing in Google Sheets, while embedded dynamic formulas auto-calculate task progress and deadlines, helping teams stay aligned and on schedule.
- What are the benefits of using this project timeline Google Sheets template?
- This free template offers a practical Gantt-style chart, task tracking, customizable formatting, and real-time collaboration, making project planning easier, faster, and budget-friendly.
- Is there a free Google Docs timeline template available?
- A free Google Docs timeline template provides a preformatted timeline overview ideal for presentations; however, Google Sheets offers more interactive, dynamic features suited for detailed project management.