
Have you ever noticed that some projects move along smoothly while others get off on the wrong foot? A project timeline chart is the tool that keeps everything on track. It lines up every task in order, much like a row of colorful blocks on your schedule, so everyone knows what to do next. Originally created in 1896, this visual roadmap has grown into a key resource for planning projects, from marketing efforts to product launches. In this post, we explain how using a project timeline chart can simplify your task flow and improve your project management.
Understanding Project Timeline Chart Fundamentals

A project timeline chart, sometimes called a Gantt chart, is a bar chart that lays out jobs, milestones, and final goals over time. It splits work into parts with clear start and end dates so you can quickly see progress and overlapping tasks. This idea started in 1896 when a Polish engineer first made the harmonogram, the original tool for planning big projects. Imagine lining up every step of a construction job on one clear chart.
This tool comes in handy for tasks like organizing marketing campaigns, scheduling client work, or planning a product launch. Back in the day, schedules were managed on paper before computers made it easier to update them. In the chart, each bar shows a task while milestones mark key points when a phase is done. Lines connect the tasks to show which ones need to come one after another. This simple, flexible layout helps you manage your time, use resources wisely, and avoid delays.
Project timeline chart: Brighten Your Task Flow
A project timeline chart is like a map that shows every step you need to take. Start by choosing a clear work period with a start date and an end date. For example, plan for 6 weeks (42 days or 6×7 days) so everyone knows the project’s boundaries.
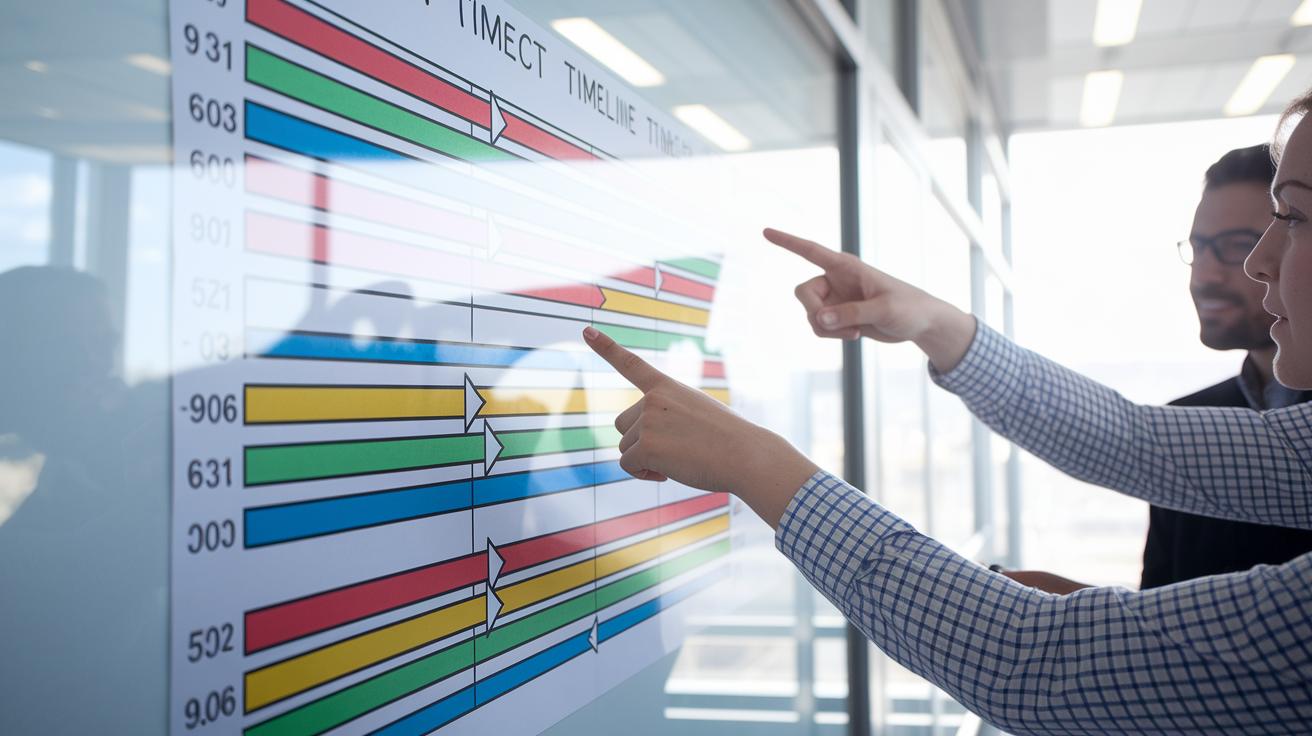
Next, list each task with its own start and end dates. Represent each task with a horizontal bar so you can see when it begins and ends at a glance. Think of it like lining up colorful blocks. For instance, you might mark a renovation to start on 5/1 and end on 5/15.
It’s also important to show which tasks depend on others. Use simple arrows to connect tasks that must happen in order. For example, pouring the foundation needs to finish before framing starts. An arrow between these bars makes that clear.
Add milestone markers to spot key achievements. You can use symbols like a star or diamond to show when a big goal, such as finishing the roof installation, is reached.
Keep the chart flexible. If project details change, update the timeline so everyone sees the new plan. This straightforward, adjustable view helps the whole team stay on track.
Creating a Project Timeline Chart in Excel: Step-by-Step Guide

Start by choosing the project’s time range in Excel. Set a clear start and end date so everyone knows the deadline. For example, plan for 8 weeks (56 days or 8×7 days).
-
Define the overall time frame.
Pick a start date and an end date. For instance, set 6/1 as the start and 7/27 as the finish. This draws the borders on your work canvas and keeps your plan focused. -
List your tasks with start and end dates.
Type each task into Excel along with its start and finish dates. For example, enter “Install drywall – 6/3 to 6/7” so every step gets its proper time slot. -
Create a bar chart to show your timeline.
Highlight your data and insert a bar or stacked bar chart. Each task will appear as a horizontal bar, like lining up colorful blocks that mark each job. -
Add arrows for dependencies and markers for milestones.
Use Excel’s drawing tools to draw arrows between tasks that depend on one another. Mark key events, like the end of framing, with shapes such as diamonds. -
Use colors and styles to clear up the chart.
Apply conditional formatting to change colors automatically based on progress. For example, a green bar can mean the task is on track while red shows delays. -
Update and adjust as the project moves forward.
Keep the chart current by updating data regularly. Change labels and axis scales as needed to reflect progress and keep everyone in the loop.
Download the timeline template here:
project timeline excel template
Top Free Project Timeline Chart Templates & Tools

Discover free project planning tools that make your tasks clearer and your project management simpler. The basic timeline shows horizontal task bars with simple dependency arrows so you can immediately see how tasks fit together. For instance, if you’re remodeling a kitchen, you can connect “Frame walls” to “Install cabinets” with an arrow that marks the dependency.
The simple timeline ramps up the features by tracking tasks, the person in charge, and current status. Picture a row that reads: “Tile floor – Alex – In Progress.” This layout makes it easy to know who is working on what and how the job is moving along.
For projects that change quickly, the agile timeline lets you rearrange tasks on the fly. It gives you the flexibility to move steps around as priorities shift. If you need a big-picture view, the advanced 12-month template splits your project into weekly and quarterly parts so you never miss a long-term deadline. And if you like options, the 2-in-1 chart lets you switch between yearly and quarterly views.
| Template Type | Ideal For |
|---|---|
| Basic project timeline | Simple tasks with clear links |
| Simple timeline | Tracking tasks and status updates |
| Agile timeline | Flexible workflows with shifting needs |
| Advanced 12-month view | Long-term planning with weekly and quarterly details |
| 2-in-1 chart | Option to view projects yearly or quarterly |
These free scheduling tools save you time while giving a clear overview of your work. They are efficient, though some models might not include custom fields for specialized projects.
Ready to plan? Grab your free project timeline template here: project timeline template.
Customizing Your Project Timeline Chart for Different Scenarios
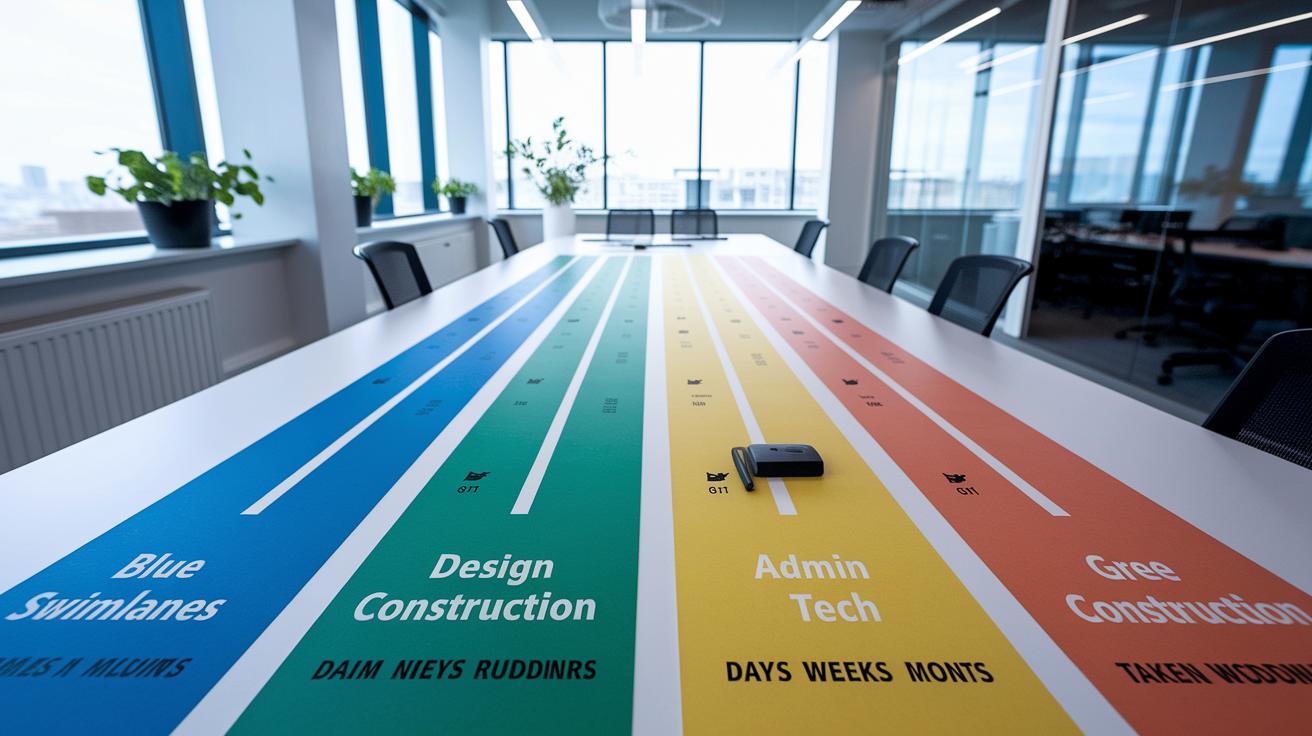
Start by choosing colors to mark different phases or teams. For example, use blue for design work and green for construction tasks. This makes it easy for everyone to see who is doing what.
Next, add swimlanes to separate different work areas. Each lane can show one set of tasks, like keeping administrative jobs in one lane and technical tasks in another.
Then, adjust the time units to fit your project. For a short event, use days; for longer jobs, use weeks or months. You can also add small icons, like a star or flag, next to key milestones to highlight important checkpoints. Switching between monthly, quarterly, and yearly views helps each stakeholder focus on what matters most.
Finally, include progress bars or status symbols for a real-time look at the work. These visual cues help you spot delays or completed tasks quickly.
- Use colors to mark phases or teams
- Add swimlanes to separate work areas
- Adjust time units, add icons, and enable different views
Customize your timeline to be a clear, interactive plan that works for every team.
Best Practices for Updating & Managing Your Project Timeline Chart

Keep your project schedule updated to avoid surprises. Start with the critical path: list the key tasks that set your finish date. For example, note that pouring concrete must finish before framing begins.
Break your project into manageable parts using a Work Breakdown Structure (WBS). This approach splits your work into clear phases so each task fits with available resources.
Show task links by drawing arrows between related tasks. This visual cue helps you spot potential delays early. Then assign enough crew and materials to meet each phase’s needs.
Check your progress with a dashboard and update your timeline often. Look out for risks and adjust deadlines or build in extra time when needed. Keep your chart flexible so changes in scope or new risks are noted immediately.
Steps to follow:
- Identify the critical tasks.
- Break work into clear phases.
- Map task dependencies visually.
Update your timeline as soon as you see issues. Regular reviews keep your schedule precise and your project on track.
Common Pitfalls to Avoid in Your Project Timeline Chart

Keep your timeline clear by avoiding simple mistakes that slow you down. First, use realistic task durations. For example, setting a tight deadline for drywall installation can disrupt the whole schedule. Instead, list only major tasks so your chart stays easy to read.
Next, pay attention to task dependencies. Know which job must finish before the next one starts to avoid delays. Marking important milestones lets you check progress and celebrate small wins.
Also, update your dates whenever your project scope or available resources change. An outdated timeline can mislead you. Finally, choose a simple template that shows only what you need instead of a cluttered one.
- Set realistic task durations
- Focus on major tasks only
- Identify which tasks depend on others
- Highlight key milestones
- Refresh dates after making changes
- Use a simple, clear template
Final Words
In the action, we explored how to build a project timeline chart that clearly maps tasks, milestones, and dependencies. We broke down the core components, guided you through an Excel setup, and reviewed free templates and common pitfalls.
This guide empowers you to customize your chart for any project. Apply these practical steps to keep your project on track, save costs, and build your skills with confidence.
FAQ
Where can I download a free project timeline template for Excel?
The free project timeline template for Excel combines task lists, dates, and milestones into one file. It lets you track progress and adjust schedules quickly for efficient project management.
Is there a free project timeline template for Word?
The free project timeline template for Word provides a simple layout that organizes tasks, dates, and dependencies. It offers an alternative for those who prefer using Word over spreadsheets.
What is a project timeline chart called?
A project timeline chart is typically known as a Gantt chart or project schedule. It visually maps tasks, milestones, and dependencies along a time axis for clear project planning.
How do I make a timeline chart for a project?
Making a timeline chart involves listing your tasks with start and end dates, drawing horizontal bars for each task, and adding markers for milestones using spreadsheet software like Excel.
What is the format of a project timeline?
The project timeline format features a horizontal time axis with task bars, dates, and milestone markers. This layout clearly shows when tasks start, their durations, and any dependencies between them.
What are the 7 elements of a Gantt chart?
A Gantt chart includes tasks, start dates, end dates, durations, dependencies, milestones, and progress indicators. These elements work together to provide a comprehensive view of your project schedule.